If you’re new to crypto trading, looking at a chart can feel confusing. All the lines, shapes, and numbers may seem like a secret code only experts understand. But once you learn what the key signals mean, you can make smarter moves and avoid big losses.
Reading crypto charts helps you see what the market is doing. It shows you where prices have been and where they might go. Charts can’t predict the future, but they give you a better chance to act before the market shifts.
In this guide, you’ll learn how to read crypto charts in a simple and clear way. You’ll understand the basics, the common tools used, and the mistakes to avoid. You don’t need to be a math genius. You just need to know what to look for.
What Is a Crypto Chart and Why Does It Matter
A crypto chart is a visual tool that shows how a cryptocurrency’s price changes over time. Traders use it to look for patterns, signals, and market trends. Whether you want to trade short-term or invest long-term, charts help you make better choices.
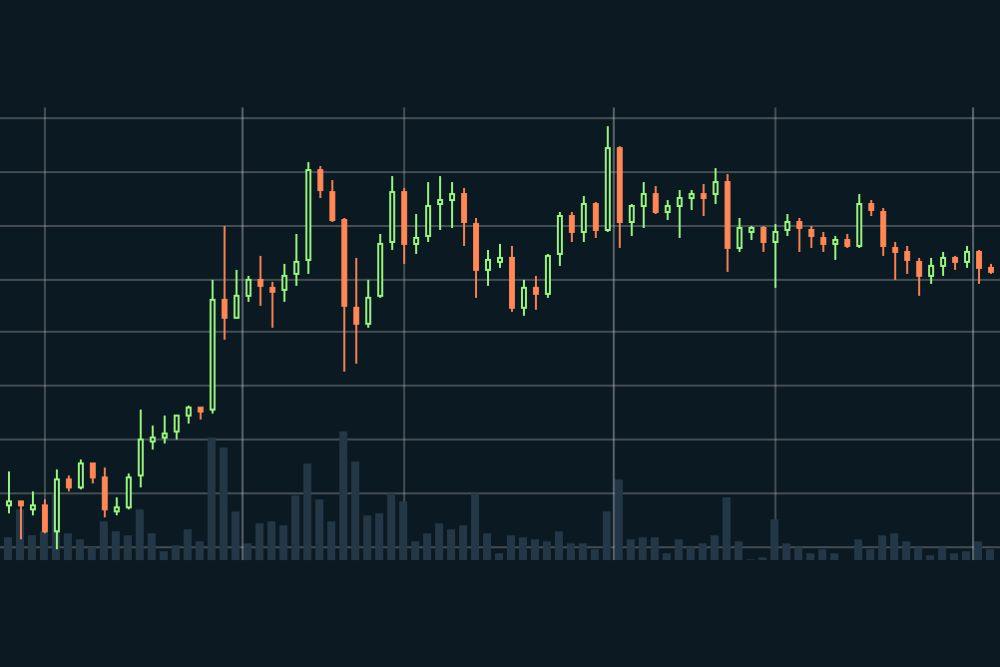
Most crypto charts display data using candlesticks. Each candlestick shows the price action for a certain time frame—like one hour, one day, or one week. It shows four key pieces of info: the opening price, closing price, highest price, and lowest price during that time.
Here’s a simple example:
If a candlestick is green, the closing price was higher than the opening price. If it’s red, the price dropped. These patterns show how buyers and sellers are acting, which helps you understand market behavior.
Types of Crypto Charts and What They Show
When you start trading or investing in crypto, charts are one of your main tools. But not all charts are the same. Each type of chart presents price data differently, and some are better suited for beginners, while others are preferred by experienced traders. Knowing the difference can help you choose the right chart for your goals and avoid being misled by unclear data.
Here’s a breakdown of the most common crypto chart types and how to use them effectively:
| Chart Type | What It Shows | When to Use It |
| Line Chart | Connects a series of closing prices over time with a straight line. | Best for beginners or long-term investors who want a clean, simple view of price movement. |
| Bar Chart | Displays the open, high, low, and close (OHLC) for each time period with vertical lines and horizontal ticks. | Useful when you want more data than a line chart but still prefer a clean format. |
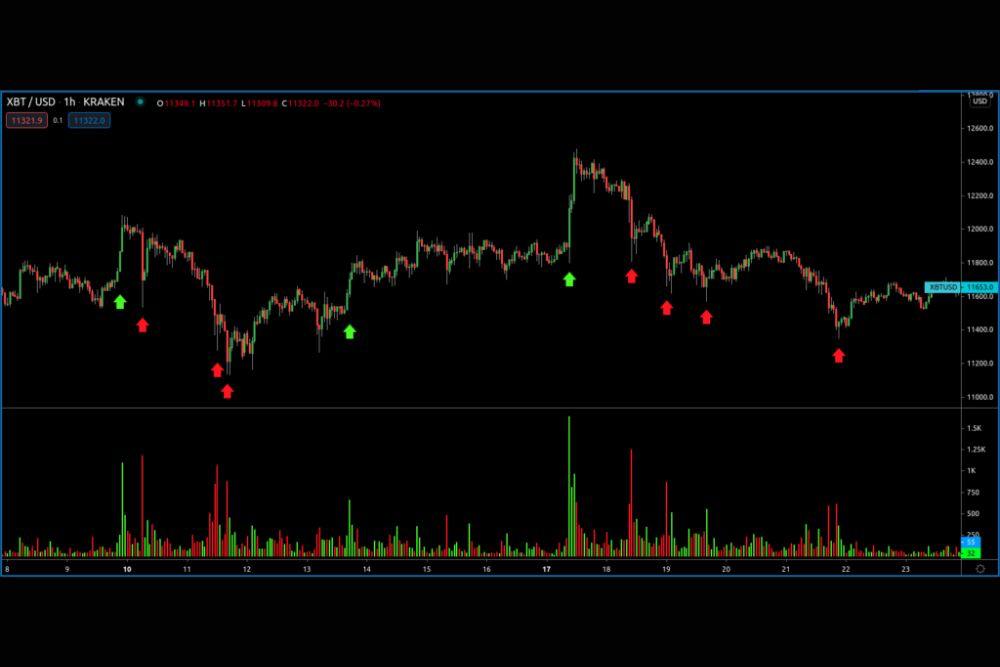
| Candlestick | Shows the same OHLC data as bar charts but with colored “bodies” to highlight price direction. | Most popular chart type for traders. Good for spotting trends, reversals, and momentum. |
| Volume Chart | Shows how much of a coin was traded in a given time frame using vertical bars. | Helps confirm trend strength. Use it to spot heavy buying or selling interest. |
| Depth Chart | Shows real-time buy and sell orders on both sides of the market (order book). | Great for short-term traders who want to see supply and demand at specific price levels. |
Let’s look at these in more detail:
Line Chart
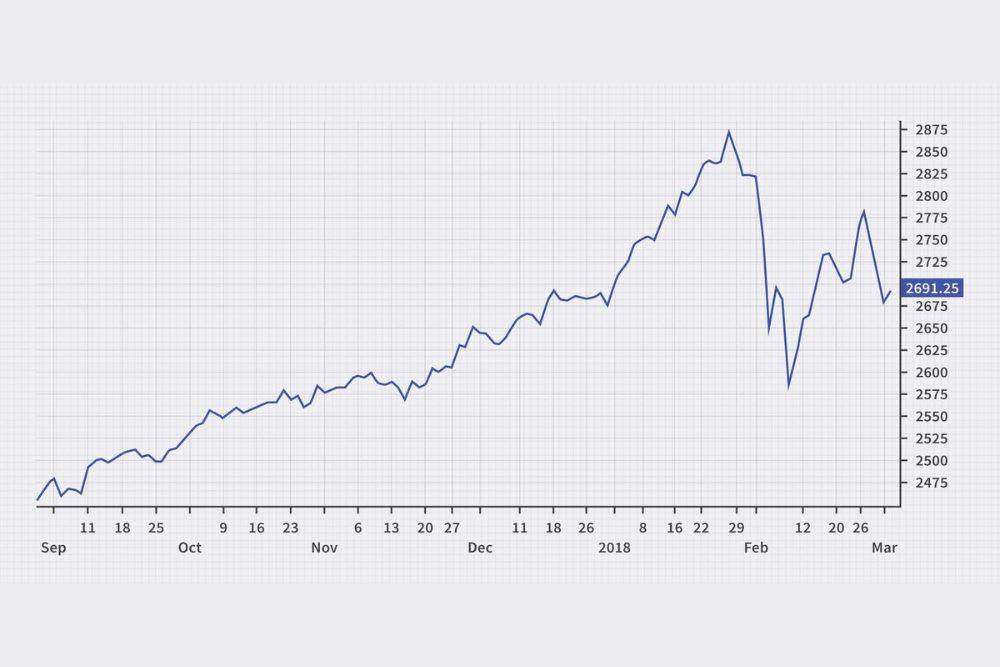
This chart is the easiest to understand. It tracks only the closing price over time. You won’t see highs or lows, but that makes it simple and clear. It’s great for long-term investors who want to see the general direction of a coin without all the market noise.
Bar Chart
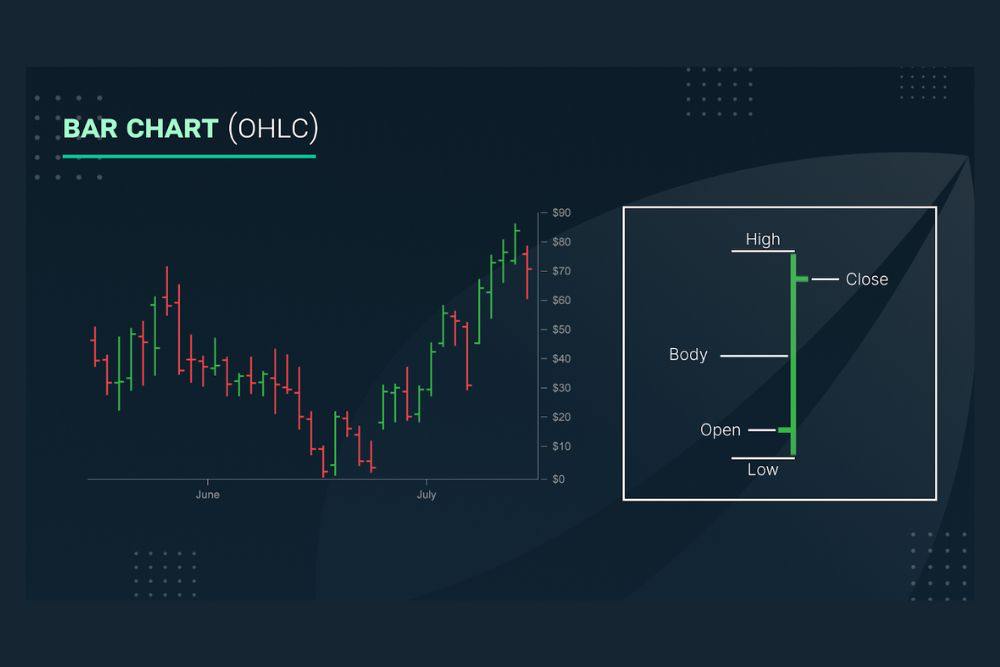
This chart gives you more data than a line chart. Each bar shows the open, high, low, and close prices for a selected time frame. It can take some getting used to, but once you know how to read it, you’ll gain a clearer picture of price behavior.
Candlestick Chart
This is the most used chart among crypto traders. Candlesticks not only show OHLC data but also give strong visual cues. A green (or white) body means the price went up. A red (or black) body means the price went down. Patterns formed by these candlesticks can hint at future market moves.
Volume Chart
Often shown below candlestick charts, volume bars represent how much of a coin was traded in each period. High volume along with a big price change suggests a strong move, while low volume can mean weak momentum.
Depth Chart
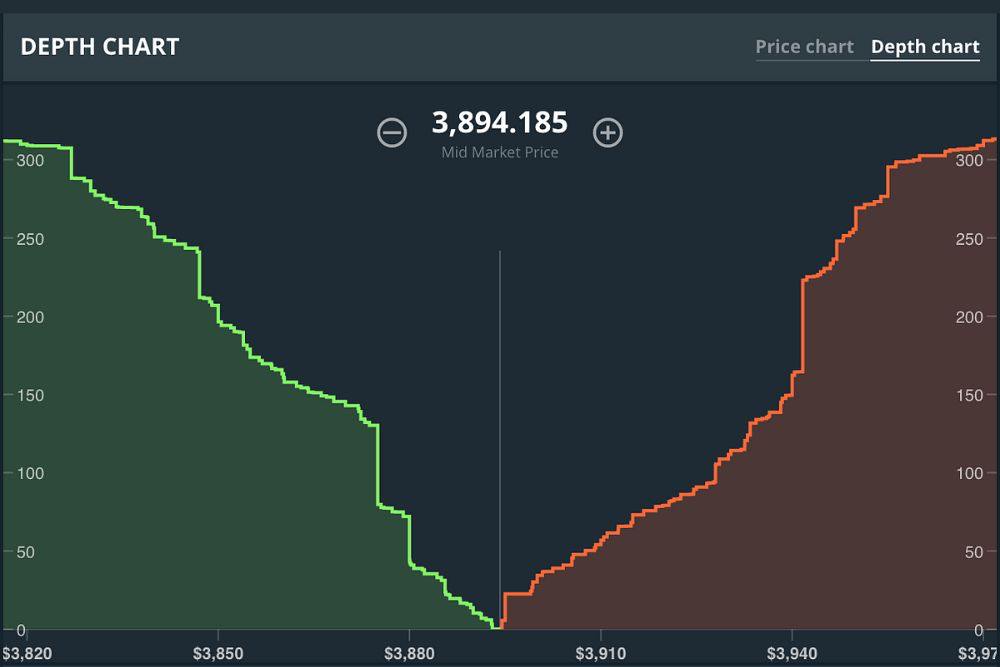
This chart is built from the order book. It displays buy (bid) and sell (ask) offers in real-time. The shape of the depth chart shows whether there’s more pressure to buy or sell at certain price points, which can help short-term traders make decisions quickly.
Choosing the right chart depends on what you’re trying to do. Long-term investors might stick to line or candlestick charts. Short-term traders often use candlesticks, volume, and depth charts together.
In short, each chart has its strengths. Most serious traders rely on candlestick charts because they offer the most detail in a visual format that’s fast to read. But no matter what type you use, the key is to understand what the chart is showing and use it to support smart decisions—not emotional ones.
Also Read: 7 Best Crypto Charts to Track Market Trends in 2025
Key Elements of a Crypto Chart You Must Know
Before you can use a crypto chart to make good decisions, you need to understand what the chart is showing you. A chart is not just a picture of price. It has different parts, and each part gives you useful information. Knowing how to read these parts is the first step to understanding the market.
Here are the main elements you should know:
Timeframe
The timeframe tells you how much time each part of the chart covers. You can look at short timeframes, like 1-minute or 5-minute charts, to see what is happening right now. Longer timeframes, like 1-day or 1-week charts, help you see the overall trend. If you are trading quickly, short timeframes are helpful. If you want to follow the big picture, longer timeframes are better. It’s a good idea to check more than one timeframe so you get a full view of the market.
Price Scale
The price scale is usually on the right side of the chart. It shows how much the coin is worth at different points. A linear scale shows the price in equal steps and is easier for beginners to read. A logarithmic scale shows price in percentage steps, which is better for spotting large changes. Beginners should start with the linear scale.
Volume Bars
Volume bars appear at the bottom of most charts. Each bar shows how much of the coin was bought or sold in that time period. High volume means many people are trading, which usually makes price moves stronger. Low volume means fewer people are trading, and price changes may not last long.
Indicators
Indicators are tools that help you read the chart better. They add extra information on top of the price and volume. Here are three common ones:
- Moving Averages (MA): This shows the average price over a set number of days. It helps you see the trend more clearly.
- Relative Strength Index (RSI): This shows if a coin is going up or down too fast. A high number means the coin might be overbought. A low number means it might be oversold.
- MACD (Moving Average Convergence Divergence): This helps you see when a trend might change. It shows the difference between two moving averages.
You do not need to use many indicators at the same time. Too many can make the chart hard to read. Start with one or two. As you learn more, you can try others.
In summary, every part of a crypto chart tells you something important. Timeframes show how prices change over time. Price scales help you read the value. Volume bars show how active the market is. Indicators give you extra clues. When you understand these basics, you can start reading charts with more confidence and make better trading choices.
How to Spot Market Trends and Signals Early
Knowing how to spot market trends early can help you make better choices and avoid buying or selling at the wrong time. Charts don’t tell the future, but they show useful signals that can guide your next move. If you learn to see these signs early, you can enter or exit a trade with more confidence.
Uptrends and Downtrends
The first step is to look at whether the price is going up or down over time.
An uptrend happens when the price keeps making higher highs and higher lows. This means buyers are stronger than sellers, and the market is moving up.
A downtrend is the opposite. The price makes lower highs and lower lows. In this case, sellers are in control, and the market is going down.
Understanding the trend helps you know if it’s a good time to buy, hold, or wait.
Support and Resistance
Support and resistance are key price levels where the market often reacts.
Support is a level where the price tends to stop falling. Traders see this as a “floor” where buyers come in and push the price back up.
Resistance is a level where the price often stops rising. It works like a “ceiling,” where sellers step in and push the price back down.
If the price breaks above a resistance level and volume is high, it could continue rising. If the price falls below a support level with strong volume, it may keep going down. These breakouts are important signs that the trend might grow stronger.
Chart Patterns
Some patterns on the chart repeat over time. Traders use them to guess what might happen next.
- Head and Shoulders: This pattern looks like a peak (shoulder), a higher peak (head), and another lower peak (shoulder). It usually signals that an uptrend is ending.
- Triangles: A triangle pattern shows prices moving into a smaller and tighter range. It often leads to a breakout, where the price moves up or down quickly.
- Double Tops and Bottoms: A double top means the price tried to go up twice but failed. This could mean a drop is coming. A double bottom means the price tried to fall twice but bounced back both times. This could mean a rise is coming.
You don’t need to memorize every pattern. Focus on a few and watch how they play out.
Divergence
Divergence happens when the price and an indicator are moving in different directions. This can be an early warning that the trend is getting weak.
For example, if the price keeps rising but the RSI (Relative Strength Index) is falling, the buying power may be slowing down. This can mean the uptrend is close to ending.
On the other hand, if the price is falling but the RSI is rising, it may be a sign that the downtrend is losing strength and a rebound could come soon.
Divergence is not always a clear signal, but it helps you prepare for possible changes.
To sum up, spotting market signals early is about watching for trends, levels, patterns, and indicator behavior. No single signal works every time, but when you see two or more signs together, it can be a strong message. Keep your analysis simple and always check more than one part of the chart before acting. This will help you make smarter, more confident trading decisions.
Also Read: 7 Best Free Crypto Analysis Websites to Consider in 2025
Common Mistakes Beginners Make When Reading Charts
Reading crypto charts can help you make better trading decisions. But if you are new, it’s easy to make mistakes. These mistakes can lead to losses, even if you use the right tools. Learning what to avoid is just as important as knowing what to look for.
Here are some common mistakes many beginners make:
1. Chasing the Hype
Some traders buy a coin only because other people are talking about it online or in the news. This is risky. A coin that is rising fast can also fall just as quickly. Always check the chart before buying. Look at the price trend, volume, and support or resistance levels to make a smart choice.
2. Ignoring Volume
Many beginners look only at price and forget about volume. But volume shows how strong a move is. If the price goes up with low volume, the move might not last. If the price rises with high volume, it’s more likely to continue. Volume helps confirm if a trend is real.
3. Using Too Many Indicators
There are many chart tools and indicators, but using too many at once can make the chart hard to read. You might see different signals that point in opposite directions, which can be confusing. It’s better to start with one or two simple tools, such as moving averages and RSI, and learn how they work before adding more.
4. Looking at One Time Frame Only
Some traders only look at short-term charts, like 5-minute or 1-hour views. These can show quick changes, but they don’t give the full picture. Long-term charts, like 1-day or 1-week, help you understand the bigger trend. Always check both short and long time frames to make better decisions.
5. No Risk Management
Even if you read the chart correctly, there is always a risk in trading. Some beginners enter a trade without a plan to protect their money. Always use stop-loss orders to limit how much you can lose. Never risk more money than you are willing to lose. Good traders manage risk carefully.
Therefore, learning to read charts is a valuable skill, but avoiding common mistakes is just as important. Don’t rely only on hype or one tool. Use volume to confirm moves, keep your chart simple, check more than one time frame, and always protect your money. With practice and caution, you can avoid early errors and improve your results over time.
Conclusion
Reading crypto charts is not just for experts. Anyone can learn it with a little time and practice. Start with the basics—know what the candlesticks mean, understand key tools, and watch how price and volume move together.
Don’t try to be perfect. The goal is not to predict every move but to understand the market better. With this knowledge, you can avoid common traps and trade with more confidence.
As the crypto space keeps growing, your ability to read charts will help you stay ahead. Keep learning, keep practicing, and let the charts guide you—not control you.

Joshua Soriano
I am a writer specializing in decentralized systems, digital assets, and Web3 innovation. I develop research-driven explainers, case studies, and thought leadership that connect blockchain infrastructure, smart contract design, and tokenization models to real-world outcomes.
My work focuses on translating complex technical concepts into clear, actionable narratives for builders, businesses, and investors, highlighting transparency, security, and operational efficiency. Each piece blends primary-source research, protocol documentation, and practitioner insights to surface what matters for adoption and risk reduction, helping teams make informed decisions with precise, accessible content.