Volatility trading is built on a simple idea: when an asset’s price starts moving more widely than usual. All traders often treat this as a signal to decide when to enter, take a position, or step out of the market. That’s because volatility gives a clearer picture of both the profit opportunities available and the level of risk involved. However, price action alone is not enough to identify what current volatility trading actually means. Volatility trading may sometimes appear sharp due to underlying fundamental factors. On the other hand, it simply reflects short-term noise driven by news reactions or thin liquidity. Pro traders need to combine real market data with proven strategies by experienced market participants. In this article you can grasp the essentials in a single read. Volatility in trading is a metric used to measure how much prices move within a certain period of time. It reflects the size and speed of price movement. A trading market can be classified as more volatile than usual when price swings grow wider and faster. This volatility is typically shaped by multiple factors:
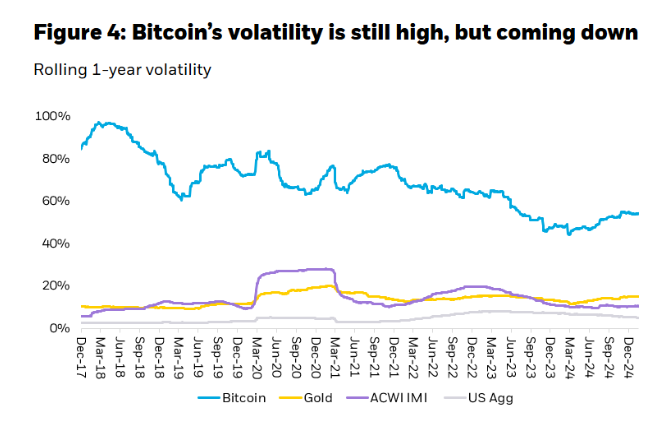
High volatility tells a different story. Sharp swings can happen in a short time. External factors often drive the move. News hits. Policy shifts. Big names drop fast. The market reacts, not thinks. In this phase, risk expands. Position size must shrink. Stop-loss must widen.
When volatility rises, forex changes character. Moves become fast. Reactions feel exaggerated. News drives the market. Liquidity can thin out. Even small orders can push prices hard. The economic calendar becomes essential. No trade should ignore it.
Crypto plays by different rules. Low volatility does not mean stability. It often signals accumulation. Smart money builds positions quietly. The price looks flat. Pressure builds underneath. Then the move comes. Volatility spikes. Price runs fast. Corrections hit hard. Market tops feel chaotic. Panic shows up. Liquidations follow. Leverage gets wiped out in minutes.
Commodities follow real-world forces. Supply. Demand. Weather. Politics. Low volatility means balance. No disruption. Prices stay stable. But balance can break fast. One headline can shift everything. A conflict. A policy change. A supply shock. Volatility rises quickly. Gaps appear. Price jumps without warning.
Indices reflect the broader market mood. Low volatility shows confidence. Trends move smoothly. The environment feels stable. Sideways strategies work well here. High volatility changes the tone. Fear enters the market. Moves become sharp. One event can shift everything. Central bank decisions. Inflation data. Geopolitical shocks. The market can stay calm, then suddenly explode. Previously if you scroll back to the fourth paragraph, you will know what is the risk of trading using leverage in a volatile market. Leverage can amplify everything. Not just profit. Loss too. In a normal setup, a 1% move in EUR/USD gives you 1%. Simple. But once you use 10:1 leverage, that same 1% move becomes 10%. Sounds attractive at first. Until the market moves against you. Now add volatility into the mix. If the price starts swinging 5% instead of 1%, the math changes fast. With the same 10:1 leverage, that move turns into a 50% gain or loss. No buffer. No room to breathe. This is where most traders get caught. Not because they were wrong in direction. But because volatility expanded faster than expected. That is why risk control matters more than entry. A stop-loss is not optional here. It is part of the trade itself. Leveraged trading in volatile conditions increases both upside and downside exposure at the same rate. That means risk grows in proportion to price movement, not just position size. Also Read: What Is Margin Trading? A Simple Guide for Beginners
 Not every trader likes fast markets. Some prefer quiet conditions. In low volatility, price does not move much. But that does not mean there is no opportunity. Short-term traders often shift their approach. They act more like liquidity providers. They place buy and sell orders around a tight range. They wait for small price differences to fill. It sounds simple. But it requires patience. Take a small-cap stock as an example. Price barely moves. It sits between $0.03 and $0.035. A trader places a buy at $0.03 and a sell at $0.035. If both get filled, the return is around 16%. The price did not trend. It just rotated. This is where perspective matters. In absolute terms, the move looks small. In percentage terms, it is not. That is why low volatility does not always mean low opportunity. It just means the strategy changes. Also, some intraday traders benefit from tight spreads in low volatility environments by repeatedly capturing small price differences rather than waiting for large directional moves. Also Read: 10 Best Investing Apps in 2026: Right Pick for Every Type of Investor
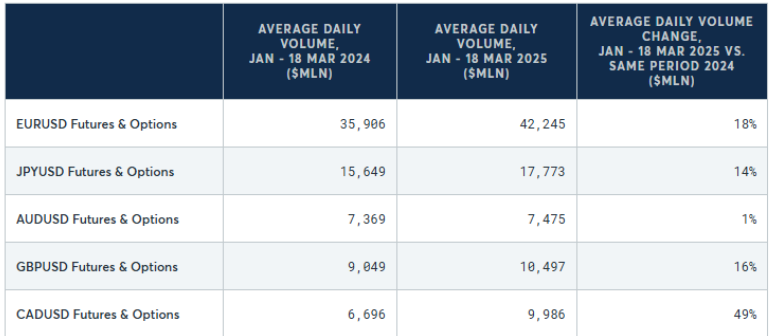
What is Volatility Trading?
Volatility in trading is a metric used to measure how much prices move within a certain period of time. It reflects the size and speed of price movement. A trading market can be classified as more volatile than usual when price swings grow wider and faster. This volatility is typically shaped by multiple factors: - Supply-demand,
- News, big events,
- Trading volume,
- Liquidity,
- Market sentiment, and
- Leverage that came up with liquidation dynamics.
- price moves in a tight range
- small candles
- low trading volume
- price moves in a wider range
- larger candles
- volume spikes
- faster price swings
- Options Trading: These traders rely on option pricing. Meanwhile, option prices are heavily influenced by volatility.
- Day Trading / Scalping: Since trades are executed within short timeframes, often within hours, volatility becomes their main fuel.
- Breakout Trading: These traders depend on momentum, which requires both volatility and volume as key drivers.
How to Identify Market Conditions Based on Volatility Across Asset Types
Before reading any signals, understand one key principle: each asset has its own volatility baseline. What is considered “high volatility” in stocks may be normal in crypto, and vice versa.Source: Bloomberg
Based on Bloomberg data as of January 2025, published by BlackRock iShares, Bitcoin’s annual volatility is around 54%, compared to 15.1% for gold and 10.5% for global equities. The takeaway: never compare volatility levels across different assets directly. Always measure volatility relative to the asset’s own historical behavior. Also Read: Top 10 Blue Chip Cryptocurrencies to Consider This YearStep 1: Understand Volatility Levels by Asset Types
Before checking any indicator, place yourself on this map. First, understand the baseline volatility of each asset so you know what “high” or “low” actually means for that market. This table explains annual baseline volatility based on asset type and its characteristics.| Asset | Annual Baseline Volatility | Dominant Character |
| Indices (S&P 500) | ~10–15% | Most stable, macro-driven |
| Large-cap stocks | 15–25% | Moderate, earnings-driven |
| Major forex pairs | 5–12% | Low, interest-rate driven |
| Commodities (Gold/Oil) | 15–30% | Geopolitics and supply-demand |
| Crypto (BTC) | 54–75% | High, sentiment-driven |
| Crypto (Altcoins) | 100–300%+ | Extreme, speculative |
Step 2: Get to Know 3 Universal Tools (Used Across All Assets)
These three indicators can be used across all asset types because they measure the most fundamental aspects of any market: price movement, volatility, and momentum. These three elements exist in every asset, whether it is stocks, crypto, forex, indices or even gold.- ATR (Average True Range)
- Bollinger Bands
- RSI (Relative Strength Index)
Step 3: Identify General Market Condition
After reading the tools above, define the market condition. Start with ATR to understand volatility. ATR above its 20-period average shows an active market. ATR below its 20-period average shows a quiet market. Then observe Bollinger Bands. Expanding bands confirm a trend or breakout. Contracting bands signal consolidation. Next, check RSI to read momentum. RSI above 70 shows strong buying pressure. RSI below 30 shows strong selling pressure. RSI between 40 and 60 shows no clear direction.Step 4: Move Into Asset-Specific Details
General market conditions give the big picture. But each asset behaves in its own way. The same volatility signal can mean one thing in stocks and something very different in crypto or forex. That is why the next step is to read each market on its own terms.Stocks
Stocks move in a rhythm that traders can read. Low volatility often means consolidation. No big catalyst. Volume is thin. Price moves slowly or sideways. This is not a dead market. Opportunity still exists. But day traders may struggle. They need bigger moves.| Low Volatility Signs | High Volatility Signs |
| Small daily price moves | Large candles and sharp daily moves |
| Narrow trading range | Wide trading range |
| Lower trading volume | Strong volume spikes |
| Stable price action between major events | Frequent gaps after earnings or macro news |
| Calm market sentiment | Fear-driven or event-driven reactions |
Forex
Forex is the most liquid market. But it is not always calm. In quiet conditions, price stays in a tight range. Signals look clean. Support and resistance work well. This is where range trading shines.| Low Volatility Signs | High Volatility Signs |
| Narrow daily range in pips | Large daily range in pips |
| Quiet sessions with limited movement | Strong moves during major news releases |
| Stable price action during off-hours | Fast reactions around rate decisions or inflation data |
| Tighter spreads | Wider spreads during active conditions |
| Low directional pressure | Clear short-term momentum and rapid repricing |
Crypto
| Low Volatility Signs | High Volatility Signs |
| Small daily percentage moves | Large daily percentage swings |
| Sideways price action | Fast directional moves or violent reversals |
| Lower volume and weaker participation | Heavy volume and aggressive participation |
| Stable market sentiment | Extreme fear or extreme greed |
| Quiet conditions between cycles | Liquidation-driven moves and sharp sentiment shifts |
Commodities
| Low Volatility Signs | High Volatility Signs |
| Stable prices over several sessions | Sharp spikes driven by supply or geopolitical shocks |
| Tight range with limited reaction | Wide price swings in a short period |
| Normal seasonal demand | Sudden changes in demand or supply expectations |
| Calm reaction to macro headlines | Strong reaction to global risk events |
| Little overnight disruption | Gap moves after major weekend developments |
Indices
| Low Volatility Signs | High Volatility Signs |
| Gradual daily movement | Large one-day index swings |
| Smooth trend with few interruptions | Sharp reversals and unstable direction |
| Limited reaction to headlines | Strong reaction to macro or policy shocks |
| Quiet sentiment in broad markets | Elevated fear across the market |
| No major gaps or panic moves | Rapid repricing during crisis conditions |
Trading Leverage in Volatile Markets
Previously if you scroll back to the fourth paragraph, you will know what is the risk of trading using leverage in a volatile market. Leverage can amplify everything. Not just profit. Loss too. In a normal setup, a 1% move in EUR/USD gives you 1%. Simple. But once you use 10:1 leverage, that same 1% move becomes 10%. Sounds attractive at first. Until the market moves against you. Now add volatility into the mix. If the price starts swinging 5% instead of 1%, the math changes fast. With the same 10:1 leverage, that move turns into a 50% gain or loss. No buffer. No room to breathe. This is where most traders get caught. Not because they were wrong in direction. But because volatility expanded faster than expected. That is why risk control matters more than entry. A stop-loss is not optional here. It is part of the trade itself. Leveraged trading in volatile conditions increases both upside and downside exposure at the same rate. That means risk grows in proportion to price movement, not just position size. Also Read: What Is Margin Trading? A Simple Guide for BeginnersHow Traders Approach Low Volatility
Not every trader likes fast markets. Some prefer quiet conditions. In low volatility, price does not move much. But that does not mean there is no opportunity. Short-term traders often shift their approach. They act more like liquidity providers. They place buy and sell orders around a tight range. They wait for small price differences to fill. It sounds simple. But it requires patience. Take a small-cap stock as an example. Price barely moves. It sits between $0.03 and $0.035. A trader places a buy at $0.03 and a sell at $0.035. If both get filled, the return is around 16%. The price did not trend. It just rotated. This is where perspective matters. In absolute terms, the move looks small. In percentage terms, it is not. That is why low volatility does not always mean low opportunity. It just means the strategy changes. Also, some intraday traders benefit from tight spreads in low volatility environments by repeatedly capturing small price differences rather than waiting for large directional moves. Also Read: 10 Best Investing Apps in 2026: Right Pick for Every Type of InvestorHow Traders Approach High Volatility
High volatility changes the game fast. Price moves wider. Price moves faster. Mistakes get punished sooner. Most traders do not try to fight that environment. They adjust to it. The first adjustment is usually position size. Traders go smaller. They reduce exposure. Then comes timing. Entries need to be cleaner. Traders wait for confirmation, whether that is a breakout, a rejection, or a clear structure on the chart. In high-volatility conditions, many also shift into momentum mode. They stop trying to call tops and bottoms. They follow the move instead. Not every trader becomes more aggressive in that setup. Some step back and wait for conditions to settle. High volatility can widen spreads, increase slippage, and make execution much harder. Risk management changes too. Stops usually need more room. Tight stops tend to get hit too easily when the market is moving fast. As CME Group notes, elevated volatility often brings wider price ranges and faster repricing. That forces traders to rethink both position sizing and execution timing.Source: CME Group
A clear example came after the US election in November 2024. The forex market became much more active and less stable than usual. A series of announcements from the new US administration triggered large moves across both G7 and emerging market currencies. Volatility rose sharply. EUR/USD increased by 61%, USDCAD by 42%, and USDCNH by 40%. At the same time, daily trading ranges expanded. CME Group also reported that this shift pushed more activity into the FX derivatives market, especially futures and options. From January to March 18, 2025, average daily volume in FX futures and options rose by 17% compared with the same period a year earlier. The takeaway is simple. High volatility creates more opportunity, but it also raises the cost of bad executionConclusion
Volatility trading is not about chasing every fast move. It is about identifying market conditions with the right context. Every type of asset has a different baseline of volatility. Stocks, forex, crypto, commodities, and indices do not move in the same way. The same signal can mean different things in different markets. That is why traders use price action, volatility indicators, and market context before making a decision. Once that baseline is clear, it becomes easier to choose the right setup, manage risk better, and avoid treating noise as opportunity. As market execution becomes more data-driven, infrastructure also starts to matter. Explore how HeLa Labs supports real-world trading environments through a scalable, low-cost Layer 1 built for speed, efficiency, and broader adoption.
Anggita Hutami, an SEO writer and digital journalist covering technology and finance since 2019. Areas of expertise include Web3, cryptocurrency, financial technology, and artificial intelligence. A strong passion lies in bridging the gap between innovation and understanding by making complex topics easier for readers to grasp. Writing goes beyond simply arranging words; it involves transforming raw data into meaningful and digestible insights.