This article provides an updated list of the top 10 technical indicators crucial for crypto trading in 2025. We’ll delve into each indicator, explaining how they work and how you can integrate them into your trading strategy. Additionally, we’ll explore related topics to enhance your understanding of technical analysis in the crypto market.
The cryptocurrency market continues to evolve rapidly, presenting both challenges and opportunities for traders worldwide. With its inherent volatility and 24/7 trading hours, navigating this landscape requires a solid understanding of technical analysis. Technical indicators have become indispensable tools for traders aiming to make informed decisions in this dynamic environment.
In 2025, the crypto market is more competitive than ever, with new coins emerging and market trends shifting swiftly. Whether you’re a seasoned trader or just starting, utilizing the best technical indicators can significantly impact your trading performance. These indicators help analyze market trends, identify potential entry and exit points, and manage risks effectively.
The Role of Technical Indicators in Risk Management
Ever feel like trading is a bit like sailing—you can’t control the wind, but you can adjust your sails? Well, technical indicators are like your compass and weather forecast rolled into one, helping you navigate the choppy waters of the financial markets. Let’s dive into how these handy tools can play a pivotal role in managing trading risks.
Setting Up Smart Stop-Loss Levels
You know that sinking feeling when a trade moves against you? That’s where stop-loss orders come in, acting like a safety net. But setting them isn’t a guessing game.
- Finding Support and Resistance with Fibonacci Retracement: Think of Fibonacci retracement levels as the market’s “sticky points”—areas where prices tend to pause or reverse. By identifying these levels, you can place your stop-loss orders just beyond them. It’s like hiding your treasure map where only you can find it, reducing the chance of getting stopped out by random market swings.
- Accounting for Volatility with Bollinger Bands: Ever notice how some days the market is calm, and other days it’s wilder than a roller coaster ride? Bollinger Bands measure this volatility. By setting your stop-loss levels in line with these bands, you ensure they are neither too tight (getting you stopped out too early) nor too loose (exposing you to bigger losses). It’s about finding that Goldilocks zone—just right!
Mastering Position Sizing and Leverage
Okay, let’s talk about money management—the unsung hero of successful trading.
- Determining Your Risk per Trade: Before you jump into a trade, ask yourself: “How much am I willing to risk?” It’s like setting a budget for a night out—you need to know your limits. Technical indicators can help pinpoint entry and exit points, allowing you to calculate potential risks and rewards more accurately.
- Being Cautious with Leverage: Leverage is like a magnifying glass—it can enlarge your gains but also your losses. It’s tempting to go big, but remember, even small market moves can have a big impact when you’re leveraged up. Use technical indicators to assess the market conditions. If the signals are mixed or unclear, maybe it’s a sign to dial back on the leverage.
Keeping Your Emotions in Check
Trading can be an emotional roller coaster, but technical indicators can help keep your head cool.
- Sticking to Your Plan: It’s easy to get caught up in the heat of the moment. Maybe there’s buzz about a hot stock or panic over a market dip. But your indicators are there to keep you grounded. They provide objective data, helping you make decisions based on facts, not feelings. It’s like having a trusted friend who tells you like it is.
Also Read: 10 Best Crypto Signals That Prepare You For Next Bull Market
- Avoiding the Trap of Chasing Losses: We all hate losing, but trying to “win back” losses often leads to bigger mistakes. If a trade doesn’t go your way, take a step back. Let your technical indicators guide you on when to re-enter the market, rather than jumping in impulsively. Patience isn’t just a virtue; it’s a strategy.
Technical indicators are more than just lines and charts—they’re your toolkit for smarter trading. They help you set effective stop-loss levels, manage your position sizes, and keep your emotions in check. So next time you’re about to place a trade, remember to consult your indicators. They might just be the co-pilot you need to navigate the markets successfully.
Top 10 Technical Indicators for Crypto Trading in 2025

Having the right technical indicators at your disposal is key to interpreting market data and making strategic trading decisions. Here are the top 10 indicators you should consider:
1. Moving Averages (MA)
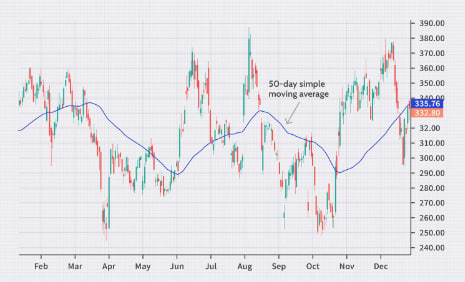
Moving averages are essential for understanding long-term price trends by smoothing out price fluctuations and noise. By averaging past prices over a specified period, moving averages help traders focus on the overall trend rather than short-term volatility. They are especially useful in identifying potential support and resistance levels, as well as trend direction.
- Simple Moving Average (SMA): Calculates the average of a selected range of prices, giving equal weight to each price point.
- Exponential Moving Average (EMA): Places more weight on recent prices, making it more responsive to sudden price changes.
Advantages:
- Helps to easily identify the market’s overall trend.
- Reduces noise and smooths out erratic price movements, making trends clearer.
Disadvantages:
- Moving averages are lagging indicators and may not react quickly to sudden price changes.
- Can generate false signals during market consolidations.
2. Relative Strength Index (RSI)
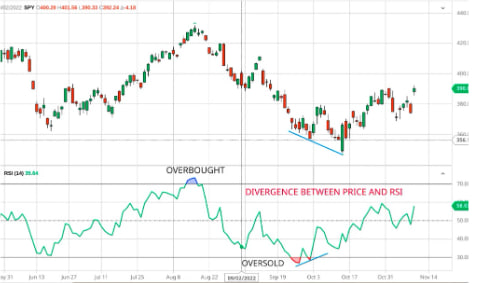
RSI is a momentum oscillator that measures the speed and change of price movements, oscillating between 0 and 100. It helps traders spot when an asset is overbought or oversold, which can signal potential market reversals. RSI is particularly useful in identifying turning points in the market, allowing traders to buy low and sell high.
- Overbought/Oversold Levels: RSI above 70 indicates overbought conditions, while below 30 suggests oversold conditions.
- Divergences: When RSI and price move in opposite directions, it may indicate an impending reversal.
Advantages:
- Effective for spotting potential market reversals based on overbought and oversold levels.
- Helps confirm trends and detect divergences between price and momentum.
Disadvantages:
- Can give false signals in strong trends where the RSI remains overbought or oversold for extended periods.
- Works best when combined with other technical indicators.
3. Moving Average Convergence Divergence (MACD)
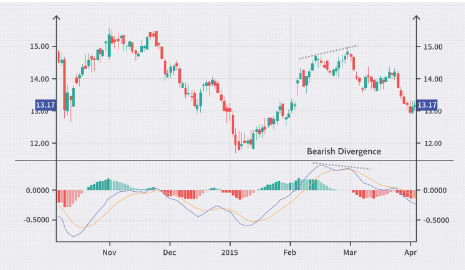
MACD is a trend-following momentum indicator that shows the relationship between two moving averages of an asset’s price. It helps traders spot changes in momentum, trend strength, and potential entry or exit points. MACD consists of two lines—the MACD line and the signal line—as well as a histogram that shows the difference between them.
- MACD Line and Signal Line Crossovers: When the MACD line crosses above the signal line, it’s often interpreted as a bullish signal.
- Histogram: The difference between the MACD line and the signal line is represented visually, showing the strength of the momentum.
Advantages:
- Combines trend-following and momentum indicators into one.
- Provides clear visual cues with crossovers and histogram movements.
Disadvantages:
- Can be a lagging indicator, potentially missing early trend changes.
- May give false signals during sideways or choppy markets.
4. Bollinger Bands
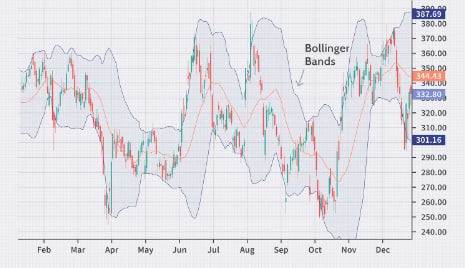
Bollinger Bands consist of a middle moving average and two outer bands representing standard deviations from the average. This indicator helps traders gauge market volatility and potential price breakouts. When the bands widen, volatility is high; when they narrow, volatility is low, signaling that a breakout might be coming.
- Price Breakouts: When the price breaks outside the bands, it indicates strong momentum and potential trend continuation.
- Squeeze: Narrowing bands signal low volatility, often followed by a significant price move.
Advantages:
- Useful for spotting volatility and potential breakouts in either direction.
- Provides a visual representation of overbought or oversold market conditions.
Disadvantages:
- Bollinger Bands don’t indicate the direction of the breakout, just that it’s likely to occur.
- Can give false signals in ranging or consolidating markets.
5. Fibonacci Retracement

Fibonacci retracement levels are horizontal lines that show where potential support and resistance levels may occur based on Fibonacci ratios. These levels are commonly used by traders to predict where price corrections will end and the main trend will resume. Key levels include 23.6%, 38.2%, 50%, 61.8%, and 78.6%.
- Key Levels: These retracement levels help traders anticipate potential reversal zones for buying or selling.
- Trading Strategy: Traders often wait for prices to reverse at Fibonacci levels to enter or exit positions.
Advantages:
- Helps identify potential support and resistance areas based on historical price movements.
- Widely used, which can make these levels self-fulfilling.
Disadvantages:
- Can be subjective depending on how the levels are drawn.
- Not foolproof—prices may break through these levels without reversing.
6. Stochastic Oscillator
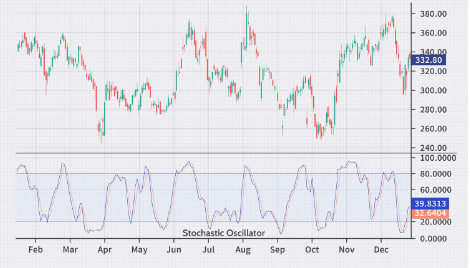
The Stochastic Oscillator compares the closing price of an asset to its price range over a certain period, giving traders insight into momentum and potential reversals. This indicator ranges between 0 and 100, with values above 80 indicating overbought conditions and below 20 suggesting oversold conditions.
- Overbought/Oversold Levels: Values above 80 signal overbought conditions, while below 20 indicate oversold conditions.
- Crossovers: The crossing of the %K and %D lines can signal potential market reversals.
Advantages:
- Great for spotting momentum shifts and potential reversals.
- Easy-to-understand overbought/oversold signals.
Disadvantages:
- Can give false signals during strong trends, where overbought or oversold conditions may persist.
- Needs to be used in conjunction with other indicators for confirmation.
7. Ichimoku Cloud
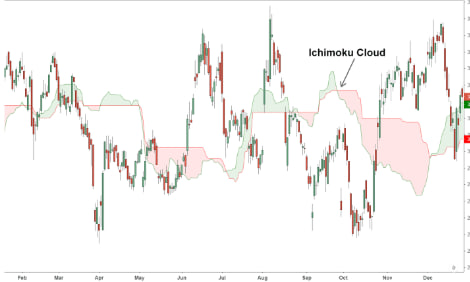
Also known as Ichimoku Kinko Hyo, this comprehensive indicator provides multiple data points, including support and resistance levels, trend direction, and momentum. The “cloud” (Kumo) represents areas of support or resistance, while other lines indicate current and future trend strength.
- Cloud Components: The cloud (Kumo) indicates future support and resistance areas.
- Trend Identification: Price above the cloud suggests an uptrend; below indicates a downtrend.
Advantages:
- Offers a full picture of market trends, support, and resistance in one glance.
- Provides future insights by projecting trend data ahead of time.
Disadvantages:
- Can be complicated for beginners due to its multiple components.
- Charts can become cluttered and difficult to read.
8. Average Directional Index (ADX)
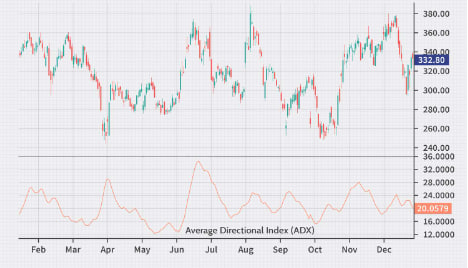
The ADX measures the strength of a trend without indicating its direction. It’s useful for determining whether the market is trending or ranging, with higher values suggesting stronger trends.
- Trend Strength: An ADX value above 25 indicates a strong trend; below 20 suggests a weak trend.
- Complementary Tool: ADX is often used with other indicators to confirm the strength of a trend.
Advantages:
- Helps identify when a strong trend is in play, allowing traders to capitalize on it.
- Can filter out weak trends or ranging markets.
Disadvantages:
- Doesn’t indicate the direction of the trend, only its strength.
- Can lag behind price movements, making it a bit slow to react to new trends.
9. On-Balance Volume (OBV)
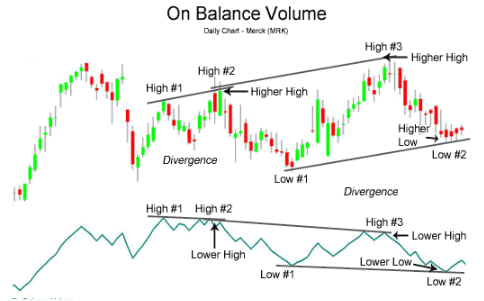
OBV uses volume to predict price movements, adding volume on up days and subtracting it on down days. It helps traders confirm price trends by analyzing whether volume supports or contradicts price movement.
- Trend Confirmation: Rising OBV confirms an uptrend, while falling OBV confirms a downtrend.
- Divergence: A discrepancy between OBV and price can signal a potential trend change.
Advantages:
- Simple yet effective tool for confirming price trends.
- Can indicate potential reversals based on volume changes.
Disadvantages:
- Ignores the magnitude of price changes and focuses solely on volume.
- Less effective during periods of low trading volume.
10. Volume Weighted Average Price (VWAP)
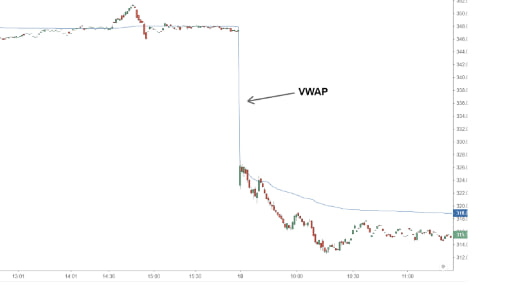
VWAP is a trading benchmark that gives the average price a security has traded at throughout the day, based on both volume and price. It’s commonly used by day traders to gauge whether a price is fair relative to the day’s trading activity.
- Benchmarking Tool: VWAP helps traders determine whether they are getting a good price.
- Trading Strategy: Price above VWAP may indicate an overvalued asset, while price below VWAP may signal a buying opportunity.
Advantages:
- Helps traders determine whether a price is fair based on the day’s trading activity.
- Easy to interpret for day trading strategies.
Disadvantages:
- Not suitable for long-term trading, as it resets every day.
- Can lag behind real-time price action, especially in fast-moving markets.
Understanding and using these technical indicators will give you a significant edge in crypto trading. Each indicator serves a specific purpose, but combining them will provide a more comprehensive view of the market. Keep experimenting with different combinations to find what works best for your trading style, and always remember that no indicator guarantees success. The key is to stay informed, practice patience, and continuously refine your strategy.
How to Integrate Technical Indicators into Your Trading Strategy

Ever find yourself lost in a flood of technical indicators, unsure of which ones to trust? Don’t stress—you’re not the only one. Let’s break down how to blend these indicators into your trading strategy in a way that actually works and, with any luck, boosts your returns.
Step 1: Read the Room (Market Conditions)
Before you dive in, take a moment to assess what’s going on in the market. Is it on a steady climb or dive (trending), or is it bouncing around in a tight range without going much of anywhere?
- Trending Markets: If the market’s moving up or down consistently, indicators like Moving Averages (MA) and the Moving Average Convergence Divergence (MACD) are your go-to tools. They’re great for spotting the momentum.
- Range-Bound Markets: When the market is stuck in a sideways shuffle, oscillators like the Relative Strength Index (RSI) and Stochastic Oscillator shine. They help you identify overbought or oversold conditions.
Step 2: Mix and Match Wisely (Combining Indicators)
Think of indicators like ingredients in a recipe. The right combination can create something amazing, but too much of one thing can spoil the dish.
- Confirmation is Key: Use indicators that complement each other to confirm signals. For example, pairing a trend indicator with an oscillator can give you a clearer picture.
- Avoid Redundancy: Don’t load up on indicators that tell you the same thing. It’s like asking the same friend for advice over and over—you won’t get a new perspective.
Step 3: Map Out Your Game Plan (Developing a Trading Plan)
Now that you’ve got your indicators sorted, it’s time to set some ground rules.
- Entry and Exit Criteria: Be crystal clear about what triggers a buy or sell for you. Maybe it’s when the MACD crosses over, or the RSI dips below a certain level.
- Risk Management: Decide on your stop-loss and take-profit points ahead of time. Use those support and resistance levels your indicators have pointed out.
Step 4: Practice Makes Perfect (Backtesting and Forward Testing)
You wouldn’t jump out of a plane without a parachute test, right? Same goes for trading strategies.
- Backtesting: Run your strategy against historical data. See how it would have performed in different market conditions.
- Paper Trading: Try out your plan in a simulated environment. It’s like a dress rehearsal before the big show, minus the stage fright.
Bringing It All Together
Integrating technical indicators into your trading strategy doesn’t have to be rocket science. It’s all about understanding the tools at your disposal and using them thoughtfully. So take a deep breath, trust your analysis, and remember—every expert was once a beginner.
Also Read: 12 Best AI Trading Bots to Consider in 2025
Common Mistakes to Avoid When Using Technical Indicators
Being aware of common pitfalls can save you from unnecessary losses.
Over-Reliance on Indicators
- Ignoring Price Action: Always consider the actual price movement in conjunction with indicators.
- Indicator Lag: Remember that some indicators are lagging and may not predict future movements.
Analysis Paralysis
- Too Many Indicators: Overloading charts can lead to confusion.
- Complex Strategies: Keep your trading plan simple and manageable.
Neglecting Risk Management
- No Stop-Loss Orders: Failing to set stop-loss levels can result in significant losses.
- Overtrading: Avoid making impulsive trades based solely on indicator signals.
Conclusion
Cryptocurrency trading in 2025 is a wild ride, and keeping up with the latest tools can make all the difference. The 10 technical indicators we’ve explored here aren’t just flashy add-ons—they’re your allies in navigating the unpredictable market. Whether it’s spotting trends or timing entries and exits, these indicators can sharpen your trading instincts. But don’t forget, no indicator is magic. Combine them with smart risk management and a solid understanding of market dynamics, and you’re much more likely to make sound decisions.
As the crypto world keeps shifting, your strategies should adapt too. Stay curious and open to new tech, and don’t be afraid to simplify your approach when needed. The key isn’t in using every tool at your disposal—it’s in knowing which ones to trust and how to apply them with discipline. Keep refining your methods, stay grounded in your goals, and you’ll be set to ride the waves of this exciting market with confidence.

Joshua Soriano
I am a writer specializing in decentralized systems, digital assets, and Web3 innovation. I develop research-driven explainers, case studies, and thought leadership that connect blockchain infrastructure, smart contract design, and tokenization models to real-world outcomes.
My work focuses on translating complex technical concepts into clear, actionable narratives for builders, businesses, and investors, highlighting transparency, security, and operational efficiency. Each piece blends primary-source research, protocol documentation, and practitioner insights to surface what matters for adoption and risk reduction, helping teams make informed decisions with precise, accessible content.